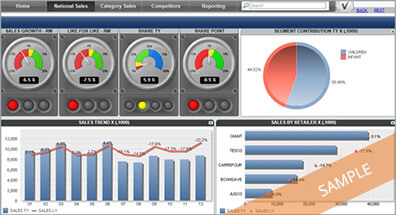
Route To Market System (RTMS) is an online BI reporting software by Qlikview technology or Microsoft platform, you can access your business information anywhere or anytime via mobile device such as iPad, iPhone or computer.
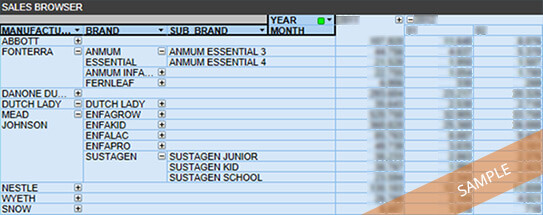
RTMS integrates all the wholesalers/distributors data, input sales, throughput sales and inventory information into a master worksheet.
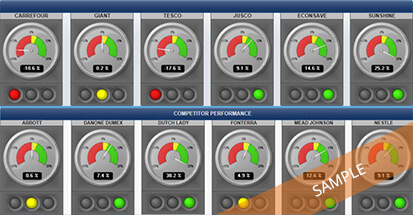
RTMS is able to assist users in managing the distributors’ sales performances and targets. The system provides users with distributors’ sales results on a weekly, monthly or yearly basis. Users are also able to monitor distributors’ performances effectively and to correctly identify the right sales channels for their products. A Salesperson’s performance can also be evaluated via RTMS.
RTM is user friendly and cost effective. Client does not require to invest large amount of BI and IT tools and the sales data will be processed and ready in the portal for client on the next business day
Benefits:
- Target and market to customers more intimately and effectively
- Collaborate with distributors and other partners transparently
- Analyze and reduce market return costs
- Monitor and respond quickly to highly demanded products
- Monitor inventory on hand more efficiently
Features:
Dashboard and online pivot table which allow users to analyze the following features via RTMS
- Distributor Performance
- Category Sales Performance
- Channel Sales Performance
- Brand and Products Performance
- Outlet and Location Performance
- Salesman Performance
- Distributor Inventory On Hand Level
- Product Distribution Performance
Why Route To Market System (RTMS)
- Users can derive better decision on production and develop the appropriate strategies to improve company’s sales.
Users can have a clear view of the sales performance from operators of mini markets and Chinese medical halls. This powerful system also allows management to view the sales performance of retail outlets, the movements of products or items, the number of outlets sold in and also salespeople’s performance. - Assure consumers that they will not face the “out of stock” situation
One of the key functions of RTM is to enable users to analyse the product distribution performance and ensure all their products are sufficiently placed or sold at all the outlets. With this, the company is able to ensure customers’ satisfaction and prevent customers from switching brands. - Users can view the inventory status of their distributors and ensure that their products are ideally and sufficiently allocated in the distributor’s warehouse.
This is to ensure ideal stock level and prevent the situation of low stock level or high stock level. High stock level will create waste of stock or high market return. From record, it shows that market return has substantially affected company’s cost of operations. - Track the different stock movements.
Users can use this system to track fast moving and slow moving stocks. This information allows users to have a more appropriate decision making in all aspects of production and marketing. Users can ensure that fast moving stocks are always top in their warehouse’s priority list. On the other hand, users can control the stock level of slow moving products. - Info On The Go. Access information everywhere, anytime.
You can access to RTMS portal and information via your mobile. Mobile access allows for easy insights on the business. View your business’s information via any mobile device or computer enables you to act quicker than your competitor. - Highly Customizable.
RTMS allows users to customize the dashboard, report templates according to their business needs. It is so flexible and powerful. - Data Visualized.
RTMS provides you a clearer and better picture of your business. You are able to view detailed, current data on all aspects of the business. Data visualization assists you in making the best and most profitable decisions at the right time.
NATIONAL KPI DASHBOARD
RTM is a universal General trade data business intelligence software. It integrates all the key wholesaler sales data and produces meaningful National account dashboard. You can view the customers trends chart, graph performance and identify the KPI or scorecard for each key account performance.
YOUR DATA BECOME MORE POWERFUL
RTM displays your business information in an easy to read table, charts and graph format. It allows you to identify critical business information with user friendly pivot table format. Just select the data fields or dimension which you want to visualize by just a drag and drop. You can drill down the information to detailed level and filter the dimension easily.
RETAILER KPI DASHBOARD
Nothing is impossible, with RTM KPI, you can easily measure the retailer’s account performance in the market. RTM can assist you to identify the valuable customer in order to sustain the business. RTM is equipped with the capability to identify competitor’s performance and total market share for the product category.
Secure Environment
User Friendly
Cost Effective
Mobile Access
Visualized Data
Customizable
How it Works
Data load from distributor system
ETL load the data into database
Client login into RTM portal for BI reporting
